

Industrial AI
Your plant's biggest cost isn't on any invoice. Industrial AI for Greek manufacturers, from an office inside the Almyros industrial area
From €4,900 · credited in full against a pilot
Scroll. The scan line shows what a vision model sees on the same line.
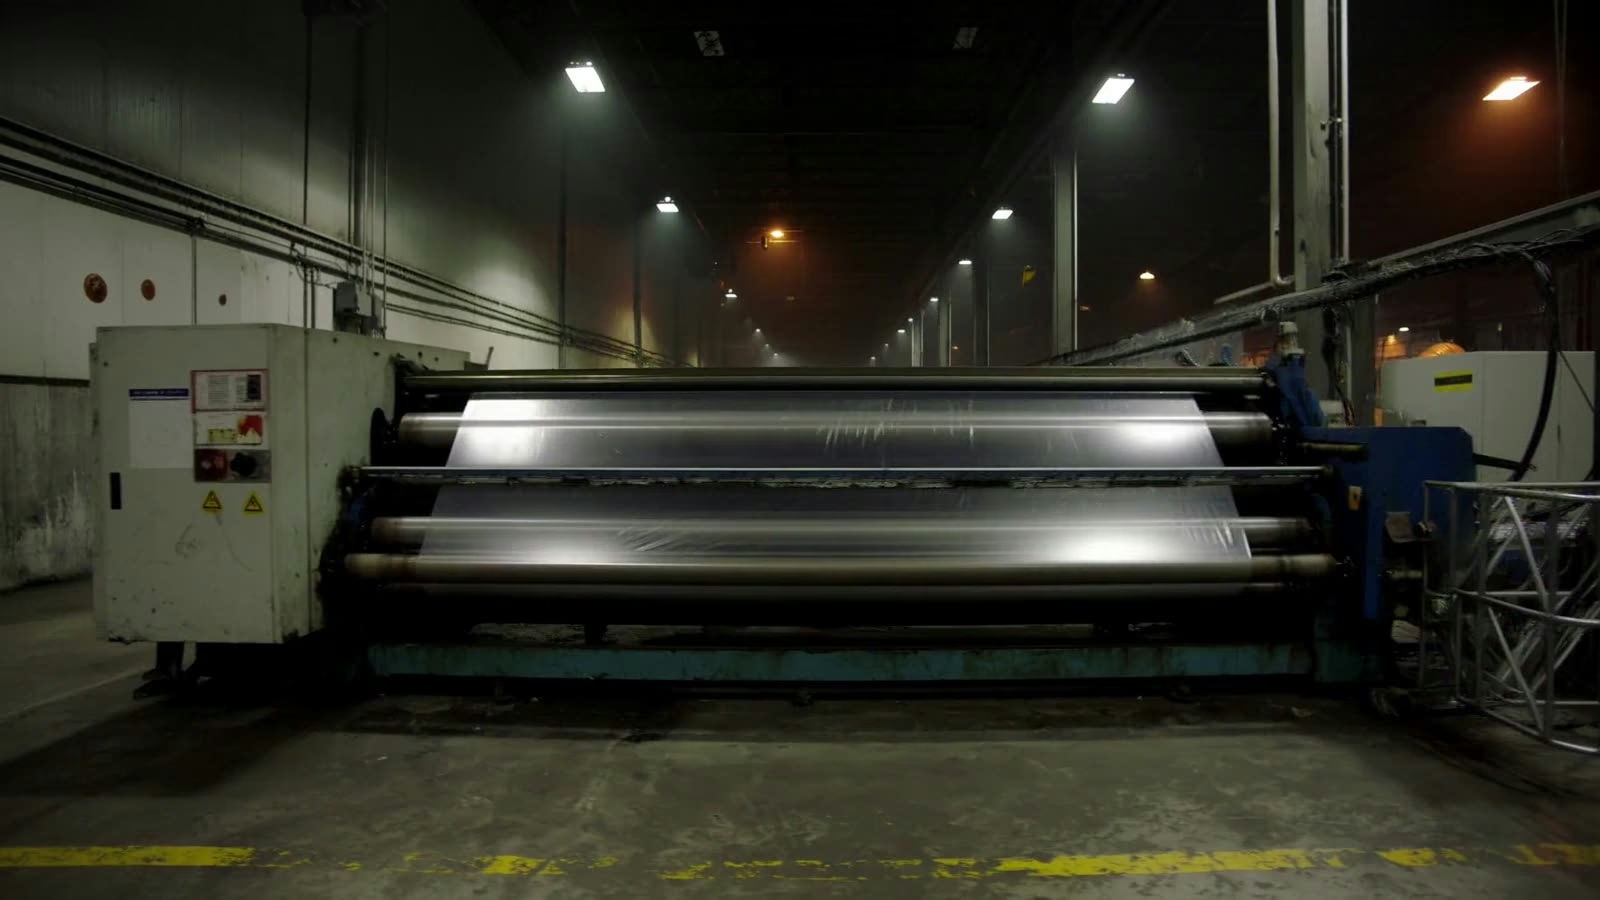
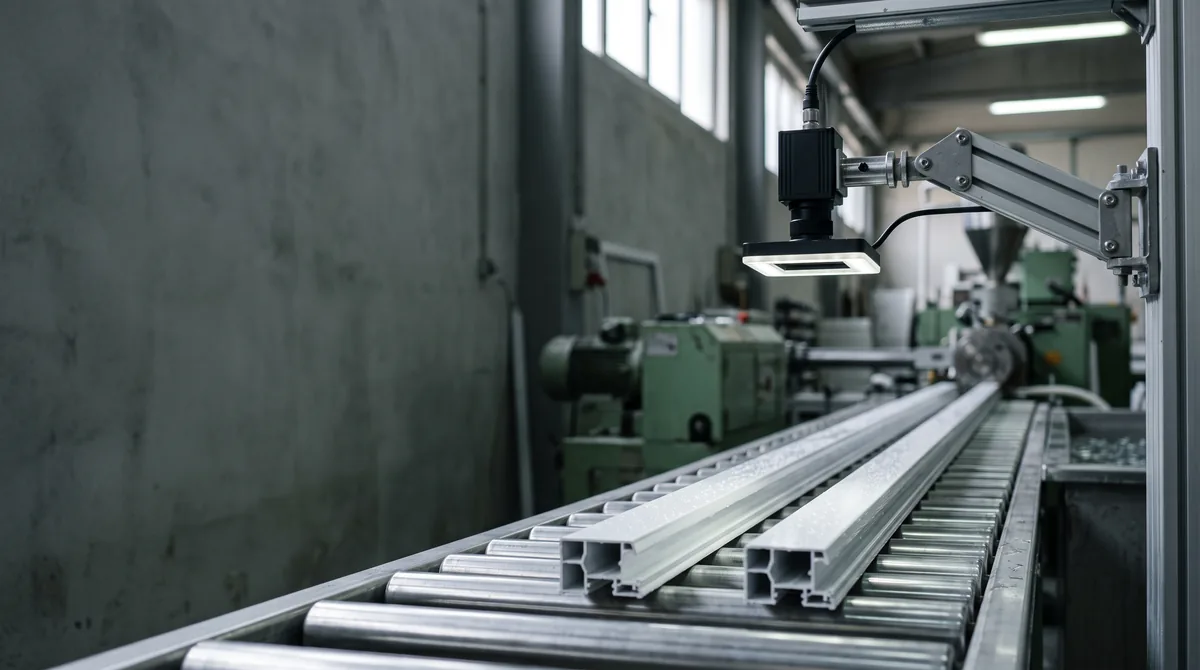
AI-generated footage of a production line at night. As you scroll, a diagonal scan line opens the machine-vision view: boxes around every part, one defect with a confidence score, a parts counter.
Engineers who sit your site safety induction before they set foot on the line. And a second office in Heraklion for plants in Crete.
It's in the hours the shift stands waiting, the parts that come back, the power burned at peak, the paper written up twice. Nobody sees all of it. We measure it.
Eurostat 2025 · firms with 10+ staff
Europe has already started.
Share of firms with 10+ staff using at least one AI technology, in Greece and across the EU. Pick a sector.
Greece 7.77% · EU 17.27%
European manufacturers use AI more than twice as often.
Greece 3.84% · EU 12.47% (2025)
Mind the year: in 2024 Greece was ahead (9.75% vs 6.79%). A swing that big in one year needs the 2026 figures to confirm it.
Greece 4.72% · EU 14.33%
Europe is three times ahead.
Basic and fabricated metals (NACE C24–C25).
Greece 12.67% · EU 16.77%
The narrowest gap on the list. But the category is broad: alongside plastics it counts cement, glass and ceramics.
In the statistics: rubber and plastics, plus non-metallic mineral products (NACE C22–C23). It isn't a plastics-only figure.
Greece 1.88% · EU 4.14%
Fewer than 2 in 100 Greek firms use AI on the production process itself.
Large 24.27% → 37.58% · Small 8.20% → 7.33% (2024 → 2025)
The large firms sped up. The small ones took a step back. Small: 10–49 staff. Large: 250 and up.
Figures from an official statistics body, with the year shown.
Source: Eurostat, tables isoc_eb_ain2 and isoc_eb_ai, 2025 data; firms with 10+ staff, financial sector excluded. isoc_eb_ain2 (opens in a new tab) isoc_eb_ai (opens in a new tab)
Shift log
Twelve notes from plants like yours.
None of them shows up on the balance sheet. All of them cost you every day. Tap one to see what's behind it.
When Nikos is on leave, line 2 stops.
-
When Nikos is on leave, line 2 stops.
Production
- What you don't see
- Time to repair (MTTR) · calls to one person
- What AI does
- A voice maintenance copilot over your manuals and past work orders
-
We type every invoice in by hand. Every one.
Accounts
- What you don't see
- Minutes per document · exceptions
- What AI does
- Document AI straight into the ERP, and on to myDATA through your provider
-
Our quote takes three days. The customer ordered elsewhere in three hours.
Sales
- What you don't see
- Time to quote · requests lost
- What AI does
- A quote copilot: the RFQ and the drawing become a draft quote
-
Our customer finds the defect, not us.
Quality
- What you don't see
- Defects reaching the customer (ppm) · credit notes
- What AI does
- Machine-vision inspection on the line
-
The machine always breaks on Friday night.
Maintenance
- What you don't see
- Unplanned downtime hours
- What AI does
- Predictive maintenance
-
We rebuild the production plan in Excel every morning.
Planning
- What you don't see
- Planner hours · mould or line changeovers
- What AI does
- Production schedule optimisation
-
We always have too much or too little. Never the right amount.
Supply chain
- What you don't see
- Waste % · stock-outs
- What AI does
- Demand forecasting
-
Orders arrive by email, Viber and phone, and someone retypes them.
Customer service
- What you don't see
- Order-entry hours · wrong lines
- What AI does
- A digital assistant that gathers orders from every channel and posts them to the ERP
-
Electricity is our second-biggest cost and nobody knows where it goes.
Operations
- What you don't see
- kWh per unit · peak kW
- What AI does
- Energy optimisation
-
Every May we train 40 seasonal staff from zero.
People
- What you don't see
- Time to competence
- What AI does
- A multilingual staff assistant over your own procedures
-
Every audit (ISO, HACCP, customer) costs us a week of paperwork.
Quality
- What you don't see
- Audit-prep hours · findings
- What AI does
- A compliance document assistant
-
The phone rings. At 15:01 nobody answers.
Front office
- What you don't see
- Missed calls · lost orders
- What AI does
- A voice assistant that passes the call to a person when it needs to
-
We close the month on the 12th of the next one.
Management
- What you don't see
- Days to close the month
- What AI does
- Reports that build themselves
-
Suppliers raise their prices and we notice months later.
Purchasing
- What you don't see
- Purchase-price drift
- What AI does
- Purchasing analytics that flags every rise the day it lands
-
Trucks queue at the gate in the morning. By afternoon the docks are empty.
Logistics
- What you don't see
- Truck turnaround minutes · gate waiting
- What AI does
- Dock scheduling with arrival forecasts
-
The mixer truck waits for the contractor. The contractor waits for the mixer truck.
Building materials
- What you don't see
- Waiting minutes per load
- What AI does
- Dispatch planning that changes with the day
-
A buyer in Munich asked for a spec sheet. We sent it three days later.
Export
- What you don't see
- Time to answer buyers · shipments held up
- What AI does
- Export paperwork and buyer replies, in three languages
The notes promise no numbers. Yours come out of your own X-Ray; here we only show what we measure.
Six senses
AI on the plant floor isn't a chat window.
It reads, sees, hears, predicts, optimises and decides. Here's where, on the plant.
Hover over, or tap, a spot on the plant.
-
Reads
The dispatch office
Delivery notes, 3.1 mill certificates, CMRs: read and posted to the ERP.
Use case Automation that gives you hours back
-
Sees
The camera over the line
Looks at every part, not one sample an hour.
Use case Vision quality control
-
Hears
The sales phone and the technician's mobile
Takes the order at 15:01 and writes the fault report from a voice note.
Use case AI Front Desk
-
Predicts
The sensor on the compressor motor
Spots the vibration anomaly before it becomes a breakdown.
Use case Predictive maintenance
-
Optimises
The energy meter and the schedule board
Moves flexible loads out of the peak and sequences orders with fewer changeovers.
Use case Plant energy optimisation
-
Decides
The reject gate at the end of the line
Pulls the faulty part off the line, within limits you set. Anything uncertain is judged by a person.
Use case Vision quality control
Process X-Ray
This is how an order travels through your company.
Pick your trade, mark your guess, then run the X-ray. See where the flow runs hot, and what changes once AI goes in.
Plastics: from RFQ to delivery
An injection-moulding plant, 60 people, 120 requests for quotation a month.
Example values that show how the calculation works.
This is how a quote request travels through your plant.
| Step | Who | Minutes | Volume/month | With AI | Minutes on the new path |
|---|---|---|---|---|---|
| RFQ arrives by email: PDF drawing and spec sheet | Sales | 4 min | 120 | Reads Pulls material, quantity, tolerances and dimensions from the email and the drawing | 0.5 min |
| Hunting for a similar past part in old quotes and folders | Sales | 15 min | 120 | Reads Finds the closest past parts and what they were quoted at | 1 min |
| Part weight and cycle time estimated in the engineer's spreadsheet | Production engineer | 25 min | 120 | Predicts Estimates weight and cycle from the plant's own history; the engineer checks it | 5 min |
| Phone call to the supplier for today's resin price | Purchasing | 10 min | 120 | Reads Takes the price from recent invoices and the supplier's list | 0.5 min |
| Quote written up in Word | Sales | 20 min | 120 | Acts Drafts the quote with every figure filled in | 3 min |
| Waiting for the owner to sign off | Management | 10 min | 120 | Stays human A person still approves the price, with everything on one screen | 3 min |
| The customer orders; the order is retyped into the ERP | Sales | 12 min | 45 | Acts Opens the order in the ERP straight from the accepted quote | 1 min |
| Resin stock checked in the warehouse spreadsheet | Warehouse | 8 min | 45 | Acts Checks stock and reserves the quantity | 0.2 min |
| Call to production: when can we fit it in? | Sales | 10 min | 45 | Predicts Proposes a slot and a delivery date; the planner confirms | 2 min |
| Email to the customer with the delivery date | Sales | 6 min | 45 | Acts Sends the confirmation the moment the date is locked | 0.5 min |
| Sample inspection at the end of the batch | Quality | 30 min | 45 | Sees A camera checks every part on the line; the inspector sees only the doubtful ones | 10 min |
| Delivery note and invoice keyed in again | Accounts | 10 min | 45 | Acts Issues the documents from the order and transmits them through your e-invoicing provider | 1 min |
| Calls: where's my order? | Sales | 5 min | 90 | Acts Answers with the order status; anything it doesn't know goes to a person | 0.5 min |
- 13 steps → 5. 233 hours → 135–174 hours a month.
- ≈ €50,800 → ≈ €29,500–38,000 a year in labour, at €18.20/hour (Eurostat 2025, manufacturing).
- ≈ 0.4–0.6 people back on real work (hours freed ÷ 160 hours a month)
- Time to quote, for requests on the new path: 3 days → same day
- The hours are redeployed, not cut.
Nobody: what you can't see
Not slow work. Work that isn't happening at all.
- Peak-power charges on the electricity bill: nobody links them to press start-ups.
- Press 3 runs 6 °C hotter than in May. Nobody is watching it.
- Lost quotes: nobody asks why the customer ordered elsewhere.
Hours = Σ (minutes × monthly volume) ÷ 60 · With AI = hours today − coverage × (hours today − hours on the new path), coverage 30–50% · € = hours × 12 × €18.20/hour (Eurostat 2025, manufacturing) · People = hours freed ÷ 160
We only count labour hours here, and conservatively: we assume that in year one only 3 to 5 cases in 10 take the new path, while the rest run as they do today. Lost output, waste and orders that went elsewhere aren't in the sum. That's what the meter further down is for.
Metals: breakdown → repair → certificate
A steel processor supplying larger manufacturers: a cut-to-length line, 45 people, 160 certificates a month.
Example values that show how the calculation works.
This is how a breakdown travels through your plant, all the way to the paper that ships with the load.
| Step | Who | Minutes | Volume/month | With AI | Minutes on the new path |
|---|---|---|---|---|---|
| The line stops without warning; the operator goes looking for the shift lead | Operator | 10 min | 8 | Predicts Motor vibration and current show the anomaly days ahead; the stop goes into the schedule | 3 min |
| The shift waits: 4 people for 90 minutes | Shift crew | 360 min | 8 | Predicts The fault shows up early and becomes a planned stop: 4 people for 40 minutes instead of 90. At this scenario's coverage that happens for 2 to 4 of the 8 breakdowns; the rest still come unannounced | 160 min |
| A call to Nikos, the only one who knows this fault | Maintenance tech | 15 min | 8 | Reads The maintenance copilot answers by voice, in Greek, from the manuals and past work orders | 3 min |
| Digging out the manual and the spare-part drawing | Maintenance tech | 25 min | 8 | Reads Shows the right page and the part number | 2 min |
| Is the spare in stock? Shelf, then spreadsheet | Stores | 15 min | 8 | Acts Shows stock and shelf location; if it's missing, raises a purchase request | 1 min |
| Ordering the spare by phone and email | Purchasing | 30 min | 3 | Acts Sends a ready request for quotation to three suppliers; the buyer decides | 5 min |
| The repair itself | Maintenance tech | 120 min | 8 | Stays human The repair stays a technician's job. It simply happens, more often, before something breaks | 120 min |
| Handwritten fault report, typed up later | Tech and office | 15 min | 8 | Hears The tech says it into a phone; the work order writes itself | 2 min |
| Mill certificates (3.1) arrive as PDFs from the steelworks | Quality | 6 min | 160 | Reads Extracts heat number, grade, dimensions and chemistry | 0.5 min |
| Cross-checking against the customer's order spec | Quality | 10 min | 160 | Reads Checks every value against the spec and flags only the mismatches | 1 min |
| Writing the certificate for the customer | Quality | 12 min | 160 | Acts Drafts the certificate from the checked data | 1 min |
| Quality manager signs | Quality manager | 3 min | 160 | Stays human A person always signs, with any mismatches already flagged | 2 min |
- 12 steps → 5. 159 hours → 105–126 hours a month.
- ≈ €34,700 → ≈ €22,900–27,600 a year in labour, at €18.20/hour (Eurostat 2025, manufacturing).
- ≈ 0.2–0.3 people back on real work (hours freed ÷ 160 hours a month)
- Line downtime per month: 12 h → 8.7–10 h The cost of lost output isn't counted here. You add it in the meter, with your own € per downtime hour.
- The hours are redeployed, not cut.
Nobody: what you can't see
Not slow work. Work that isn't happening at all.
- The decoiler motor draws a little more current every week. Nobody looks until it stops.
- The same spare part is rush-ordered again and again: nobody counts how often a year.
- Customers asking for the certificate a second time: nobody records how many, or why.
Hours = Σ (minutes × monthly volume) ÷ 60 · With AI = hours today − coverage × (hours today − hours on the new path), coverage 30–50% · € = hours × 12 × €18.20/hour (Eurostat 2025, manufacturing) · People = hours freed ÷ 160
We only count labour hours here, and conservatively: we assume that in year one only 3 to 5 cases in 10 take the new path, while the rest run as they do today. Lost output, waste and orders that went elsewhere aren't in the sum. That's what the meter further down is for.
Food: forecast → production → waste
A dairy, 70 people, fresh products for supermarkets and hotels.
Example values that show how the calculation works.
This is how a week of demand travels through your plant, all the way to the waste bin.
| Step | Who | Minutes | Volume/month | With AI | Minutes on the new path |
|---|---|---|---|---|---|
| Milk intake from farmers: weighbridge slip filled in by hand | Intake | 5 min | 400 | Reads Weight and slip go straight to the farmer's account | 0.5 min |
| Supermarket orders by email, portals and phone | Sales | 5 min | 300 | Reads Pulls every order into one list, by SKU | 0.5 min |
| Next week's demand, guessed in a spreadsheet | Sales manager | 180 min | 4 | Predicts Forecasts each SKU from weather, holidays, retailer promotions and the tourist season; the manager signs it off | 30 min |
| Production plan rebuilt in Excel every morning | Planner | 60 min | 22 | Predicts Proposes a plan with the fewest changeovers; the planner adjusts it | 15 min |
| Rush order: the plan is redone mid-shift | Planner and supervisor | 40 min | 10 | Predicts Re-sequences in seconds and shows what moves | 10 min |
| Milk and packaging: calls to stores and suppliers | Purchasing | 30 min | 22 | Acts Matches needs against stock and deliveries; alerts only on shortfalls | 5 min |
| HACCP logs on paper: temperatures, pasteurisation | Operator | 15 min | 44 | Reads Readings come from the sensors; the operator confirms and signs | 3 min |
| Spot checks of labels and use-by dates | Quality | 20 min | 44 | Sees A camera at the end of the line reads every date and lot code | 3 min |
| End-of-day waste weighed and written on paper | Warehouse | 20 min | 22 | Acts The scale logs waste by SKU straight into the report | 3 min |
| Expired returns from retailers: counting and credit notes | Accounts | 15 min | 40 | Reads Reads the return notes and prepares credit notes for approval | 2 min |
| Monday report for the owner, stitched from four files | Accounts | 120 min | 4 | Acts Writes itself every Monday, with forecast error by SKU | 10 min |
- 11 steps → 5. 161 hours → 93–120 hours a month.
- ≈ €35,200 → ≈ €20,200–26,200 a year in labour, at €18.20/hour (Eurostat 2025, manufacturing).
- ≈ 0.3–0.4 people back on real work (hours freed ÷ 160 hours a month)
- Waste: measured daily by SKU, not once a month
- The hours are redeployed, not cut.
Nobody: what you can't see
Not slow work. Work that isn't happening at all.
- Waste climbs every Monday after a long weekend. Nobody has linked it to Friday's order.
- SKUs that always come back from the same store: nobody asks why.
- The cold-room temperature is logged on paper. Nobody sees the night-time peaks.
Hours = Σ (minutes × monthly volume) ÷ 60 · With AI = hours today − coverage × (hours today − hours on the new path), coverage 30–50% · € = hours × 12 × €18.20/hour (Eurostat 2025, manufacturing) · People = hours freed ÷ 160
We only count labour hours here, and conservatively: we assume that in year one only 3 to 5 cases in 10 take the new path, while the rest run as they do today. Lost output, waste and orders that went elsewhere aren't in the sum. That's what the meter further down is for.
Wholesale: Viber order → invoice
A food distributor in Crete, 35 people, 900 orders a month from shops and tavernas.
Example values that show how the calculation works.
This is how an order travels, from a Viber voice note to money in the bank.
| Step | Who | Minutes | Volume/month | With AI | Minutes on the new path |
|---|---|---|---|---|---|
| The order lands on Viber: voice note, photo of a list, or text | Sales desk | 3 min | 900 | Reads Turns voice, photos and text into order lines | 0.5 min |
| "The usual cheese": which product code is that? | Sales desk | 4 min | 900 | Reads Matches descriptions to codes from the customer's history; asks only when unsure | 1 min |
| Retyped into the ERP | Sales desk | 6 min | 900 | Acts Creates the order in the ERP | 0.5 min |
| Balance and credit-limit check | Accounts | 3 min | 900 | Acts Checks the limit and holds only the orders that exceed it | 0.3 min |
| Call to the warehouse: do we have it? | Sales desk | 3 min | 300 | Acts Shows availability and suggests a substitute | 0.3 min |
| Confirmation back to the customer on Viber | Sales desk | 2 min | 900 | Acts Sends the lines and the delivery window | 0.2 min |
| Calls: when is my order coming? | Sales desk | 3 min | 400 | Acts Replies on Viber with the delivery status; a person takes the exceptions | 0.3 min |
| Delivery note and invoice issued, lines checked | Accounts | 3 min | 900 | Acts Issues the documents from what was actually loaded and transmits them through your provider | 0.3 min |
| "You brought me two short": credit note | Accounts | 15 min | 60 | Reads Reads the message and the signed proof of delivery; prepares a credit note for approval | 3 min |
| Matching payments: bank transfers and drivers' cash | Accounts | 4 min | 700 | Reads Matches payments to invoices; the accountant approves the suggestions | 0.5 min |
| Chasing overdue invoices by phone | Accounts | 5 min | 120 | Acts Sends a polite reminder with the balance; the difficult conversations stay human | 1 min |
| Monthly sales report by customer | Management | 240 min | 1 | Acts Builds itself on the 1st of every month | 15 min |
- 12 steps → 5. 426 hours → 241–315 hours a month.
- ≈ €81,700 → ≈ €46,300–60,500 a year in labour, at €16.00/hour (Eurostat 2025, trade).
- ≈ 0.7–1.2 people back on real work (hours freed ÷ 160 hours a month)
- The hours are redeployed, not cut.
Nobody: what you can't see
Not slow work. Work that isn't happening at all.
- Customers who ordered every week and then stopped: nobody notices for months.
- Lines that run out every Friday by 11:00: nobody counts the orders they cost.
- Discounts agreed on the phone and written down nowhere: nobody checks them against the invoice.
Hours = Σ (minutes × monthly volume) ÷ 60 · With AI = hours today − coverage × (hours today − hours on the new path), coverage 30–50% · € = hours × 12 × €16.00/hour (Eurostat 2025, trade) · People = hours freed ÷ 160
We only count labour hours here, and conservatively: we assume that in year one only 3 to 5 cases in 10 take the new path, while the rest run as they do today. Lost output, waste and orders that went elsewhere aren't in the sum. That's what the meter further down is for.
Logistics: truck arrival → POD → billing
A third-party warehouse near the port of Volos, 50 people, 600 trucks a month.
Example values that show how the calculation works.
This is how a truck travels through your warehouse, all the way to the customer's bill.
| Step | Who | Minutes | Volume/month | With AI | Minutes on the new path |
|---|---|---|---|---|---|
| Dock slot booked by phone and email | Traffic office | 5 min | 600 | Predicts Offers a dock slot based on expected arrivals and workload | 0.5 min |
| Gate: the guard writes plate and time in a logbook | Gate | 3 min | 600 | Sees A camera reads the plate and ties it to the booking | 0.3 min |
| Receiving: damage photographed when someone remembers | Warehouse | 3 min | 600 | Sees Every pallet photographed on arrival, possible damage flagged | 0.5 min |
| CMRs and delivery notes typed into the WMS | Office | 8 min | 600 | Reads Reads the CMR and delivery note and opens the receipt in the WMS | 1 min |
| Quantity mismatch: email to the customer with whatever evidence turns up | Office | 20 min | 40 | Acts Drafts a discrepancy report with photos and documents | 4 min |
| Shift rota set by gut feel | Warehouse lead | 60 min | 22 | Predicts Forecasts tomorrow's volume and suggests headcount per shift; the lead decides | 10 min |
| Calls: where's my shipment? | Customer service | 4 min | 800 | Acts Answers on Viber and email from the WMS; a person takes the exceptions | 0.5 min |
| POD: the driver sends a photo, the office files it | Office | 3 min | 1,200 | Reads Reads signature, date and remarks, and closes the delivery | 0.3 min |
| POD remarks ("short") discovered at month-end | Office | 25 min | 30 | Reads Flags the remark the moment the photo arrives | 5 min |
| Customer billing: WMS movements pasted into Excel | Accounts | 90 min | 25 | Acts Calculates billing from movements and contract rates; the accountant approves | 10 min |
| Billing dispute: digging for proof | Accounts | 40 min | 8 | Reads Finds PODs, photos and timestamps in seconds | 5 min |
- 11 steps → 5. 394 hours → 222–291 hours a month.
- ≈ €133,800 → ≈ €75,300–98,700 a year in labour, at €28.30/hour (Eurostat 2025, transport and storage).
- ≈ 0.6–1.1 people back on real work (hours freed ÷ 160 hours a month)
- The hours are redeployed, not cut.
Nobody: what you can't see
Not slow work. Work that isn't happening at all.
- Trucks waiting over an hour at the dock: nobody bills the waiting time.
- Damage visible in the receiving photos: nobody matches it to the claims that arrive months later.
- One customer disputes the same charge every month: nobody has fixed the clause in the contract.
Hours = Σ (minutes × monthly volume) ÷ 60 · With AI = hours today − coverage × (hours today − hours on the new path), coverage 30–50% · € = hours × 12 × €28.30/hour (Eurostat 2025, transport and storage) · People = hours freed ÷ 160
We only count labour hours here, and conservatively: we assume that in year one only 3 to 5 cases in 10 take the new path, while the rest run as they do today. Lost output, waste and orders that went elsewhere aren't in the sum. That's what the meter further down is for.
Olive oil: from olive intake to export
An olive mill and bottler in Crete, 25 people, 300 growers, exporting to Germany and the US. Peak-month volumes (November to January).
Example values that show how the calculation works.
This is how a load of olives travels, from the weighbridge to the container.
| Step | Who | Minutes | Volume/month | With AI | Minutes on the new path |
|---|---|---|---|---|---|
| Olive intake: weighbridge slip written by hand | Intake | 3 min | 900 | Reads Weight and grower details go straight into the system | 0.3 min |
| Acidity and lab results typed into Excel, grower by grower | Lab | 4 min | 900 | Reads Reads the analyser output and links it to the load | 0.5 min |
| Grower settlements: kilos, yield, quality, price | Accounts | 10 min | 300 | Acts Produces each grower's settlement from the same data; the accountant approves | 1 min |
| Growers ringing: how much oil did I get? | Office | 4 min | 600 | Acts Replies on Viber with yield and acidity; complaints go to a person | 0.3 min |
| A buyer abroad asks for price, sample and spec | Export desk | 30 min | 40 | Reads Drafts a reply in English or German from the spec database; the export manager approves | 6 min |
| A product spec sheet for every buyer | Export desk | 45 min | 10 | Acts Builds the sheet from that batch's lab analyses | 8 min |
| Quote including freight: calls to forwarders | Export desk | 40 min | 10 | Acts Requests freight rates in parallel and drafts the quote | 10 min |
| Shipping documents: origin, analyses, packing list, invoice | Export desk | 120 min | 8 | Acts Fills in the documents from the order and the batch | 20 min |
| Checking against the buyer's requirements; one error holds the load at customs | Export desk | 40 min | 8 | Reads Checks every document against the buyer's list and flags mismatches | 5 min |
| Keeping the buyer posted on the shipment | Export desk | 10 min | 16 | Acts Sends an update at every status change | 1 min |
| Traceability for a buyer audit: which growers, which tank | Quality | 180 min | 2 | Reads Shows the batch's path from weighbridge slips to bottle | 15 min |
- 11 steps → 5. 259 hours → 145–191 hours a month.
- ≈ €56,600 → ≈ €31,700–41,700 a year in labour, at €18.20/hour (Eurostat 2025, manufacturing).
- ≈ 0.4–0.7 people back on real work (hours freed ÷ 160 hours a month)
- Reply to a buyer, on the new path: 2–3 days → same day
- The hours are redeployed, not cut.
Nobody: what you can't see
Not slow work. Work that isn't happening at all.
- Growers who brought fewer olives this year: nobody rang to ask why.
- Buyer enquiries from Germany left unanswered over the weekend: nobody counts how many are lost.
- Every batch's acidity is on record, but nobody links it to the grove and the harvest day.
Hours = Σ (minutes × monthly volume) ÷ 60 · With AI = hours today − coverage × (hours today − hours on the new path), coverage 30–50% · € = hours × 12 × €18.20/hour (Eurostat 2025, manufacturing) · People = hours freed ÷ 160
We only count labour hours here, and conservatively: we assume that in year one only 3 to 5 cases in 10 take the new path, while the rest run as they do today. Lost output, waste and orders that went elsewhere aren't in the sum. That's what the meter further down is for.
Ready-mix: order → dispatch → delivery ticket
A ready-mix concrete plant in Heraklion, 14 mixer trucks, 1,100 loads a month.
Example values that show how the calculation works.
This is how a concrete order travels, from the contractor's phone call to the invoice.
| Step | Who | Minutes | Volume/month | With AI | Minutes on the new path |
|---|---|---|---|---|---|
| The contractor rings: "tomorrow 7:00, 24 cubic metres of C25/30" | Dispatch | 6 min | 500 | Hears The voice assistant takes the order and reads back quantity, grade and time; anything unclear goes to a person | 1 min |
| Tomorrow's schedule on a whiteboard, in marker | Dispatch | 45 min | 22 | Predicts Plans runs so trucks wait neither at the plant nor on site; the dispatcher has the final say | 10 min |
| Same-day changes: rain, a site that isn't ready | Dispatch | 15 min | 120 | Predicts Re-plans the runs and tells the drivers | 3 min |
| Drivers calling: where to, which gate? | Drivers | 3 min | 1,100 | Acts Sends route, pour point and site contact to the driver's phone | 0.3 min |
| The truck waits on site | Driver | 15 min | 1,100 | Predicts Departures are timed to the site being ready; in this scenario waiting drops, it doesn't vanish | 10 min |
| Handwritten ticket, signed on site | Driver | 3 min | 1,100 | Acts Digital ticket from the batch weights, signed on the phone | 1 min |
| Ticket photos typed into the ERP | Accounts | 3 min | 1,100 | Acts Ticket data arrives in the ERP already structured | 0.3 min |
| The contractor disputes the quantity | Accounts | 30 min | 15 | Reads Pulls up batch weight, departure time, route and signature | 5 min |
| Strength-test results typed into Excel and sent to the customer | Lab | 10 min | 120 | Reads Logs results from the compression tester and sends the report | 2 min |
| Monthly invoicing per site | Accounts | 30 min | 80 | Acts Consolidated invoice from the month's tickets; the accountant approves | 3 min |
- 10 steps → 5. 604 hours → 422–495 hours a month.
- ≈ €131,900 → ≈ €92,200–108,100 a year in labour, at €18.20/hour (Eurostat 2025, manufacturing).
- ≈ 0.7–1.1 people back on real work (hours freed ÷ 160 hours a month)
- The hours are redeployed, not cut.
Nobody: what you can't see
Not slow work. Work that isn't happening at all.
- Loads that come back with concrete left over: nobody measures how many cubic metres are thrown away each month.
- The same contractor cancels at the last minute every rainy Friday: nobody has built it into the schedule.
- Sites that always pay late: nobody sees it before the next load leaves.
Hours = Σ (minutes × monthly volume) ÷ 60 · With AI = hours today − coverage × (hours today − hours on the new path), coverage 30–50% · € = hours × 12 × €18.20/hour (Eurostat 2025, manufacturing) · People = hours freed ÷ 160
We only count labour hours here, and conservatively: we assume that in year one only 3 to 5 cases in 10 take the new path, while the rest run as they do today. Lost output, waste and orders that went elsewhere aren't in the sum. That's what the meter further down is for.
X-ray your own flow45 min · free · no slides
Game · 60 seconds
Spot the defect.
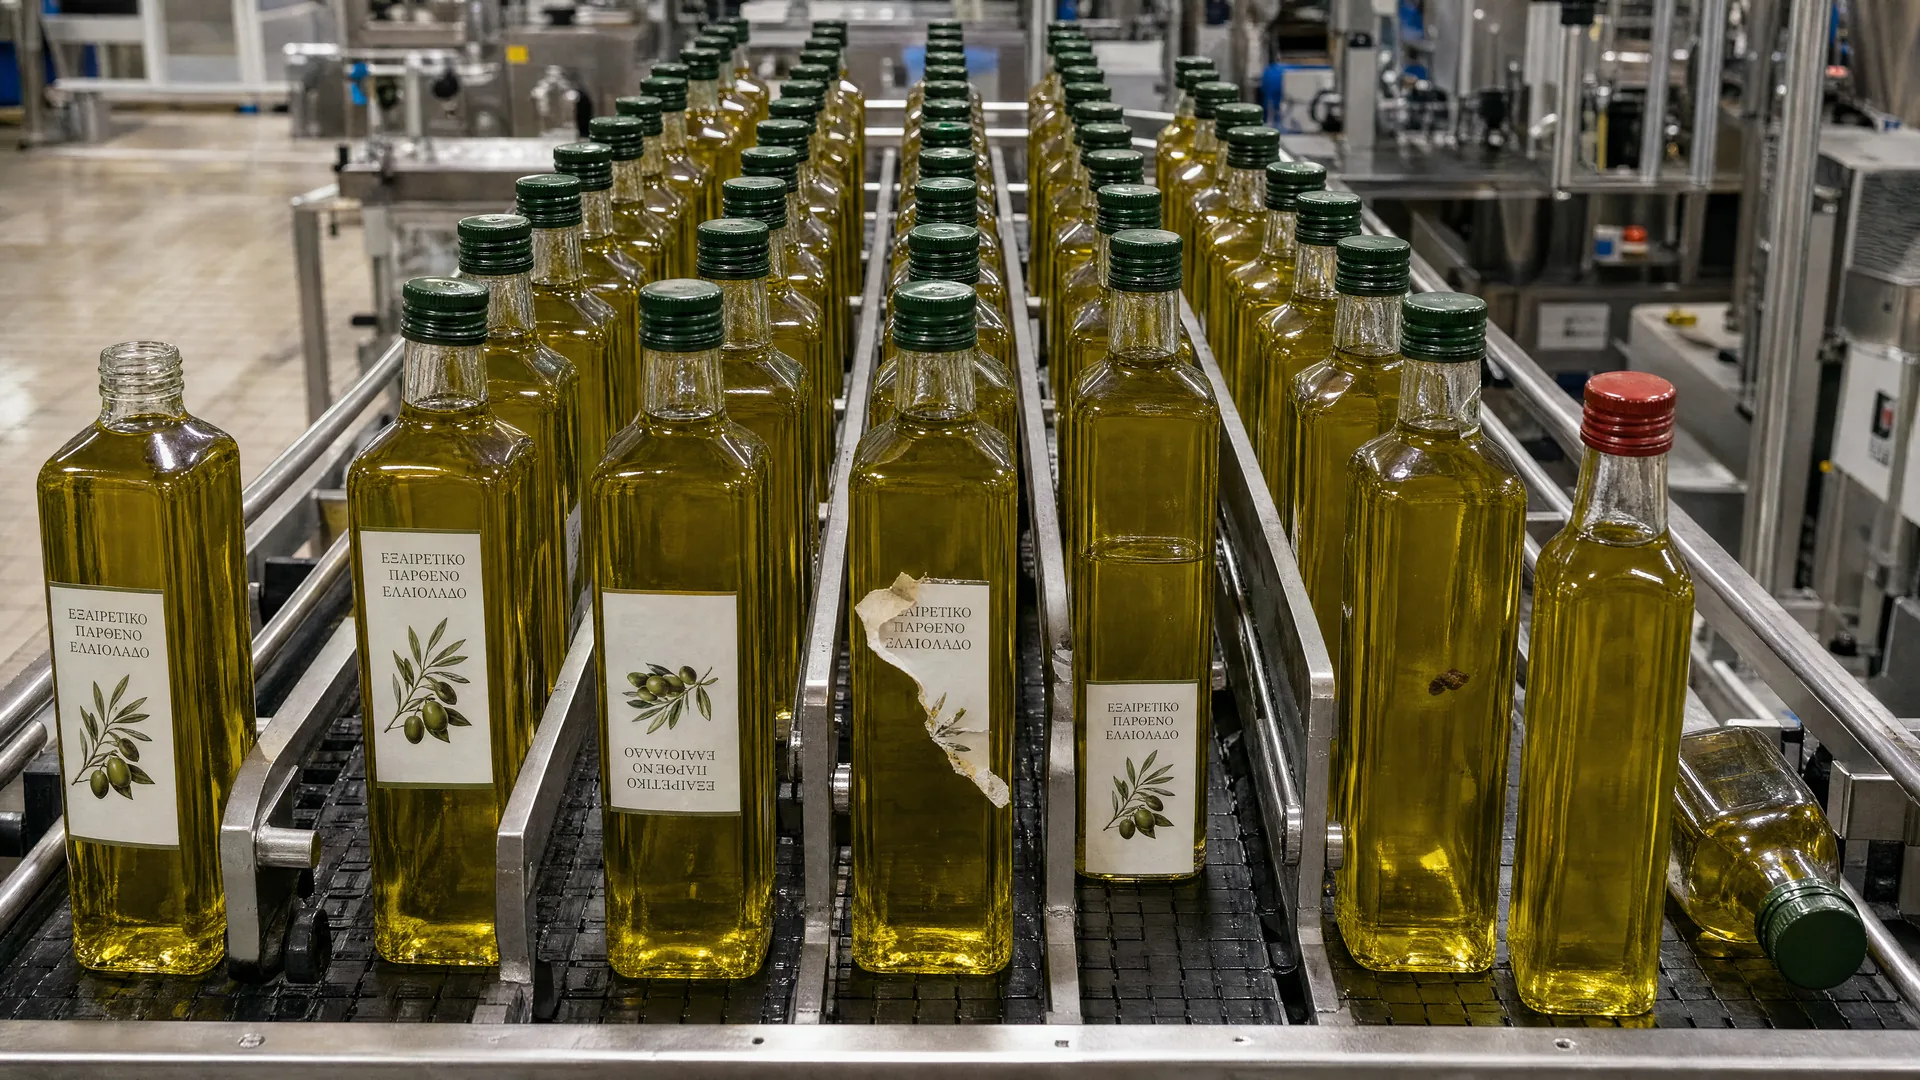
An olive-oil bottling line, eight defects. You have 60 seconds. Then you see what a machine found in the same image.
Before you start: the image was made with AI and hides 8 defects.
Your line runs 24/7. Your inspectors blink.
We look at them and tell you whether a camera can catch them. It's the first step of a Plant X-Ray.
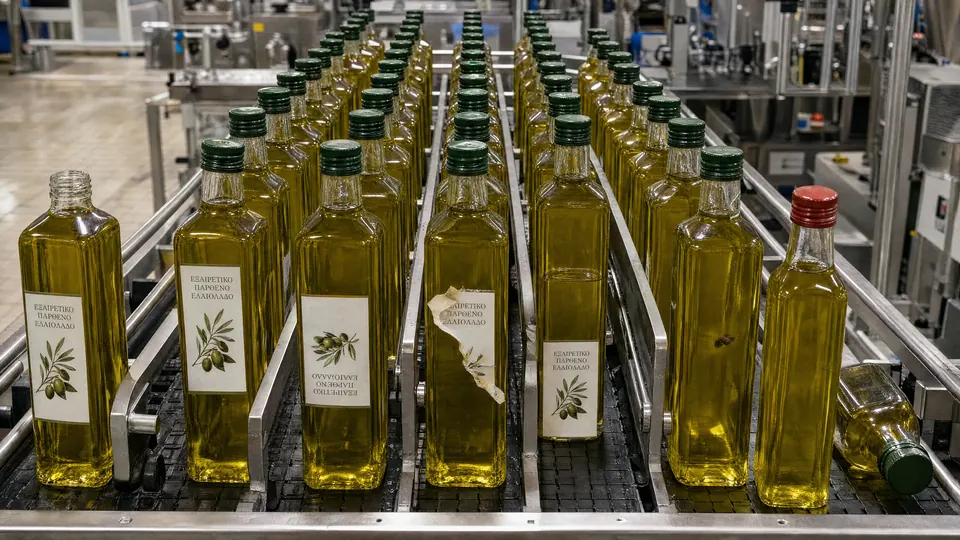
Tap every defect you can see. Zoom in for the small ones.
- Missing cap
- Upside-down label
- Torn label
- Label applied too low
- Underfilled bottle
- Foreign particle
- Wrong cap
- Tipped-over bottle
When the clock stops, you see what the vision model flagged on this line, false alarms included.
Text version: the list of the 8 defects
All eight, one by one
- Missing cap The neck is bare, threads showing: the bottle leaves unsealed. Missing cap (open neck, threads visible) · 0.94
- Upside-down label Text at the bottom, olive branch at the top: the label went on upside down. Label upside down · 0.90
- Torn label Its left part is missing and the lower edge hangs loose. Torn / peeling label · 0.92
- Label applied too low It sits almost at the base, far lower than on the bottles beside it. Label applied too low · 0.72
- Underfilled bottle The oil sits well below the shoulder the others are filled to; same bottle as the low label. Low fill level (visible meniscus below shoulder) · 0.55
- Foreign particle A dark fragment is floating in the oil. Foreign particle in the oil · 0.68
- Wrong cap A red cap in a batch of green ones: the wrong closure reached the capper. Wrong cap colour (red instead of green) · 0.91
- Tipped-over bottle It has fallen on its side on the conveyor and can jam the line. Bottle tipped over on conveyor · 0.95
What the machine found
The machine: 8/8 · missed: 0 · false alarms: 3.
It missed none of the 8.
It also saw 3 defects that aren't there: Label missing ×2 · Dark spot on glass, possible chip.
The machine found all eight, but it also saw three that aren't there. See where it went wrong.
- The boxes are what the vision model flagged on this line.
- Confidence is the model's own estimate for each finding. It ranks the findings; it isn't a probability.
- A box counts as a find when it overlaps the defect by at least 0.3 (IoU).
- On your own line the defects may be smaller and the frame moves. That's why the system is trained during the pilot on defect photos from your line.
Open the decode
Decode
Play → Decode → Deploy- Mechanism
- A hidden-object game against a machine.
- Psychology
- A competence challenge, then a comparison. You feel the gap instead of reading about it.
- Platform signal
- Engineers share scores and challenge colleagues. On LinkedIn it reaches a pool of 3.1 million members in Greece (DataReportal 2026).
- Honest range
- 2–5% of players from the industry ask for a feasibility check.Typical range for a pilot in a Greek SME · Netex estimate
- Lineage
- Who did it before us, and what we kept.Frontify ran a B2B hidden-object game: over 40,000 plays in the first month and +96% leads in two weeks (self-reported, via Econsultancy). Econsultancy (opens in a new tab)
What we build
Four steps, in order of risk.
We start where the risk is lowest. We earn trust with numbers, then go deeper.
- Energy The safest first step. We measure where the power goes before we change anything. What we measure kWh/unit · peak kW Pilot 6–10 weeks Your plant's energy
- Vision quality control Every part, not a sample. Often on IP cameras you already have, if the lighting allows. What we measure escaped ppm · scrap % Pilot 6–8 weeks on one line Vision QC
- Predictive maintenance Friday's breakdown shows up on Wednesday, if you're listening to the right signals. What we measure unplanned downtime h/month · MTBF Pilot 8–12 weeks on 3–5 critical assets Predictive maintenance
- Planning and operator copilot The plan without the morning spreadsheet. Nikos's know-how, there even when he isn't. What we measure planner hours · MTTR Pilot 6–10 weeks The operator copilot
- The plant's paperwork EN 10204 3.1 certificates, delivery notes, HACCP logs: read, checked, posted to the ERP. What we measure minutes/document · mismatches caught Pilot 4–6 weeks Automations that give hours back


A Netex estimate, given as a range with the formula alongside. Not a promise. Pilot lengths are typical ranges. The exact length goes into the pilot charter.
On your line
Who touches your line, and how.
- Systems
- ERP, SCADA, historian, PLC. We start read-only. We write back only where you sign off on it.
- Protocols
- OPC UA, Modbus TCP, MQTT; CSV exports where there's nothing else.
- Cameras and light
- Vision inspection stands or falls on lighting. We test it in the camera trial, before we propose any hardware.
- Edge or cloud
- Anything that makes decisions on the line runs locally, beside the line. Only reports and training data go to the cloud, with your agreement.
- Safety
- A safety induction before every visit. No work on a machine that hasn't been isolated and locked out.
- Cybersecurity
- We connect to the production network only through the route your network owner sets, and every access is logged. If your plant falls under NIS2 (Greek Law 5160/2024), we factor that in from the X-Ray onwards.
Bundle
Smart Plant Starter
Four pieces that talk to each other from day one.
- Energy monitoring and optimisation
- Vision quality control on one line
- A plant dashboard: energy, quality and stops on one screen
- Alerts on the right person's phone, not in an inbox nobody opens
Hardware (cameras, meters, sensors) comes from partners where it's needed. We take on the data, models, dashboards and alerts. The data stays yours.
Priced after the Plant X-Ray, once we know the line.
Hidden Cost Meter
Put your own numbers in.
The Production tab is already open. Four sliders, one result, the formula underneath.
Hidden Cost MeterWork sheet
Department Production & maintenance
- Minutes of manual logging per shift
- 45 min
- Shifts per month
- 44
- Unplanned downtime hours per month
- 6 h
- People idle during each stop
- 4
- € per downtime hour (your figure)
- €1,500
- Hourly labour cost
- €18.20/hour
Eurostat lc_lci_lev, 2025 · official statistics
- Hidden hours per month
- 57
- What could be automated
- People back on real work
- 0.08–0.15 full-time equivalentsWe don't count jobs cut. We count time given back.
- Payback against a pilot
- 5–6 months Against a typical pilot of €6,000 to €18,000.
What we'd build
- Predictive maintenance on 3–5 critical assets
- Sensor logging instead of paper
- A voice maintenance copilot
Funding. In the X-Ray we check which programme fits, if any does, against the current call text.
The formula
Hidden cost/year = [(logging minutes × shifts ÷ 60) + (downtime hours × idle people)] × 12 × €/hour + (downtime hours × 12 × € per downtime hour)
Cost/year = hidden hours/month × 12 × hourly cost (+ external cost, where there is one). Automatable = labour cost × department coefficient (0.20–0.40) + external cost × a second coefficient. People = hidden hours/month × coefficient ÷ 150 hours. Payback = pilot cost ÷ (automatable ÷ 12).
The coefficients are our own conservative estimate, shown here so you can challenge them. 150 hours is one person's productive time in a month (≈1,800 a year).
The form will already hold your numbers.
The method, for plants
Ten working days inside your plant.
We don't ask how your process works. We read it from your data.
-
Day 1
Safety and a walk
Safety induction, meeting the shift, a walk down the line with a stopwatch and a camera.
-
Days 2–3
Shadowing the shift
Photos of the paper on the desks, a document census, conversations with the people who "just know".
-
Day 4
The flow, from the data
Lightweight process mining: ERP timestamps (order → delivery note → invoice) plus email and Viber metadata.
-
Day 5
Energy, downtime, quality
Bills or meter data, breakdown logs, scrap records.
-
Days 6–7
Camera test
On one line: what the camera sees, in what light, at what speed.
-
Day 8
Opportunity map
Every opportunity on a Value × Feasibility grid, with hours, euros and risk.
-
Day 9
A demo on your own material
For example, defects marked on photos of your own line.
-
Day 10
Readout and charter
To the owner and the CFO. A pilot charter with success thresholds, signed before any code.
What we need from you
- Power bills or meter data
- Breakdown, downtime and quality logs
- An export from the ERP
- Access to one line for the camera test
Whatever we do on site, we fit around your shift pattern.
The numbers, with their formulas
- Hours freed = Σ (touchless volume × minutes saved) ÷ 60, minus review time
- Labour value = hours × 12 × €/hour
- Downtime avoided = hours avoided × € per downtime hour
- OEE = Availability × Performance × Quality
- Payback (months) = one-off cost ÷ net monthly benefit
Pilot targets are signed before any code is written.
Honest AI
Every model makes mistakes. Here's where.
 This image was created with an AI tool (AI Act, Article 50).
Three false alarms
Here the machine saw two bottles "missing a label". The whole right-hand lane runs unlabelled, in every row: that's how it works, not a defect. The model doesn't know the line's spec.
And here it saw a "dark spot on the glass". It's scuffing and reflection on the steel guide rail, not on the bottle.
Confidence 0.45, 0.40 and 0.38: the three lowest in the run. In a production system, anything below the reject threshold isn't binned; it goes to a person.
On this image, a 0.5 threshold would drop all three false alarms and keep all 8 finds. At 0.6 it would lose the underfill, which the model found at only 0.55. A threshold is a trade-off; we set it together, on your own parts.
And what did it miss? On this image, nothing. Its defects are large and clear; on your own line they may be smaller, and the frame moves. That's why the inspector stays on the line, and why the system is trained during the pilot on defect photos from your own line.
How we contain it
- A confidence threshold. Below the line we agree together, the machine rejects nothing on its own.
- A human review queue. The grey zone goes to an inspector, with the photo and the reason.
- Logs. Every decision is recorded: what it saw, how sure it was, what happened next.
- Retraining. Every correction the inspector makes becomes an example for the next version of your model.
In the pilot we measure accuracy and false alarms on your own parts, and hand them to you in writing.
What we don't promise
- A factory that runs itself.
- A percentage saving before the X-Ray.
- Fewer people.
The hours we free up go where you need people.
Proof
Other people's numbers, until ours are in.
Our measured industrial cases will go here, with a method note, a baseline period and what the AI didn't do. Until then, this is what others have measured, with the source and what kind of source it is.
What others have measured
-
≈ 2,000 hours
of unplanned downtime and 53 interruptions avoided over 3 years with predictive maintenance (BlueScope, 2022)
-
≈ 9%
lower production cost from process optimisation at a steelmaker (Gerdau, 2021)
-
27 hours
a month lost to unplanned downtime at the average large plant
-
up to −40%
cooling energy with machine learning, in a data centre (2016): an analogue, not a factory
-
69% · 3–4%
of Greek SMEs need predictive maintenance; 3–4% use it
Funding
Which programme covers what.
We don't sell grants. We show you which programme fits, if any does.
Last reviewed: 13 October 2026
| Programme | Status | What it could cover | Where it fits |
|---|---|---|---|
| Development Law, "Manufacturing – Supply Chain" scheme, cycle 4 (2026) source (opens in a new tab) | Call decision dated 16 April 2026 | Investment in equipment and automation: cameras, meters, systems | Energy and vision inside the plant's investment plan |
| New AI scheme for SMEs (€150m) source (opens in a new tab) | Announced · terms unpublished · checked 13 October 2026 | According to the announcements: AI applications, staff training, integration consultants, infrastructure | X-Ray, pilot, team training |
| ESPA: Advanced Digital Transformation of SMEs source (opens in a new tab) | Closed to new applications; implementation extended to 31 months | For approved beneficiaries: AI-based data analysis and production optimisation | Delivering an approved project that has stalled |
| Thessaly: "Αναπτύσσομαι έξυπνα" ("Growing smart", 70% grant) source (opens in a new tab) | Closed on 31 March 2026; approved projects have 24 months to deliver | Projects of €50k–425k; software and SaaS within limits | Magnesia businesses with an approved project |
| Recovery Fund loans via the Hellenic Development Bank source (opens in a new tab) | Moving to the Development Bank from 1 September 2026 | Low-interest financing for digital transformation projects | Scaling up after the pilot |
| Social Climate Fund source (opens in a new tab) | Announced, being rolled out | Part of the budget for SME infrastructure and energy-cost reduction | Energy measurement and optimisation |
Subject to the current call text. We never build a project that only works if a grant comes through.
Every X-Ray includes a funding annex: which programme could cover which line of the project.
Questions
Before you call us.
What can AI actually do in a factory?
Four things, in order of risk: it measures and shifts energy use, checks every part with a camera, predicts breakdowns from vibration and current, and supports planners and operators. Alongside that, it reads the plant's paperwork: certificates, delivery notes, HACCP logs. Which of these makes sense for you is what the X-Ray shows.
Do we need to buy new equipment?
Often not. We start from what you have: IP cameras, energy meters, PLC and ERP data. Where something is missing, such as a vibration sensor on a critical motor, the X-Ray says so, with the cost and the reason. Partners supply the hardware; we take on the data, the models and the alerts.
How much does it cost?
The Plant X-Ray starts at €4,900 and is credited in full against a pilot signed within 60 days. Pilots start at €6,000; an industrial pilot is priced after the X-Ray, once we know the line, the data and the target.
How long does a pilot take?
Six to twelve weeks, depending on the step: energy 6–10, vision 6–8 on one line, predictive maintenance 8–12 on 3–5 critical assets. Success thresholds are signed before the build starts. If they aren't met, you see it in the same numbers we do.
Will it replace our people?
No, and we don't sell it that way. AI takes the retyping, the searching and the sample checks. The inspector judges the doubtful parts, the technician repairs, the planner decides. The hours freed go where you need people, and we measure them.
What happens to our production data and images?
We follow the Netex AI Trust Standard: processing in the EU, a data processing agreement, every decision logged. Your data doesn't train third-party models. The cameras look at the product and the line, not at people: we don't score employees.
Does it work with our ERP and machines?
That's the job: we connect what you already have. ERPs such as SoftOne, Entersoft or Epsilon, myDATA through your provider, PLC and meter data. If a connection can't be made, you find out in the X-Ray, before you pay for a pilot.
Is there funding?
Possibly. There's no open programme for everyone today. The new AI scheme for SMEs has been announced, but its terms aren't published yet. The Development Law covers equipment investment, and approved ESPA beneficiaries are still delivering. Every X-Ray has an annex listing what fits. We don't sell grants.
Where are you, and how soon can you come?
In Heraklion and inside the Almyros industrial area. We visit plants across Thessaly and Crete, and we sit your safety induction before we go near the line.
Plant X-Ray
Let us X-ray your plant.
Ten working days. An Hours-Leak Map, five opportunities with the payback worked out, a live demo on your own data and a funding annex.
From €4,900 · credited in full against the pilot
Work orderNTX-XR