

Η σελίδα υπάρχει και στα ελληνικά. Διαβάστε τη στα ελληνικά

Book an X-RayX-Ray Book a Workflow X-Ray: a fixed-price diagnosis

Industrial AI · Energy

“Electricity is our second-biggest cost.”

“Nobody knows where it goes.”

Note on the shift board

AI energy optimisation for manufacturing plants

We read the meters, PLCs and bills you already have. We see every kWh by line, by shift, by unit. Then we move whatever can wait out of the expensive hours.

Production never waits. Only the loads that can afford to.

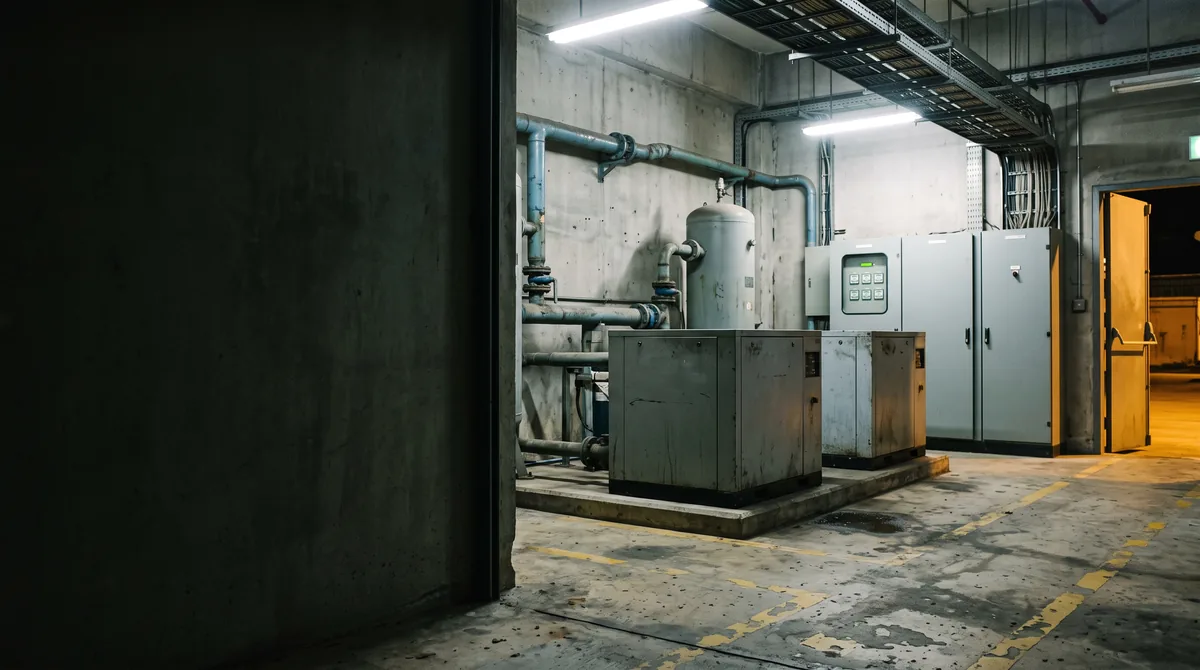
Factory compressor room at night with compressed-air pipes, a receiver tank and electrical cabinets with energy meters.Base load with no output (kW)This image was created with an AI tool (AI Act, Article 50).

Greece compared with the EU: 7.77% of Greek manufacturers with 10+ staff use AI, against 17.27% in the EU. Source: Eurostat.

Enterprises with 10+ staff. source (opens in a new tab)Eurostat, AI use by sector (isoc_eb_ain2), 2025 Figures from an official statistics body, with the year shown.

Expensive window 18:00–⁠22:0000:0003:0006:0009:0012:0015:0018:0021:0024:00PressesDryersChillerCompressor
An example calculation for a typical plant. Your own figures come from the X-Ray.

The invisible problem

The bill says how much. Not where, when or why.

The bill arrives once a month, as one number. Inside it are things nobody ordered: a compressor running all weekend to feed leaks, a chiller set for August in the middle of February, three dryers that start together at 07:00 and set the month's peak.

Nobody does it out of neglect. The electrician sees machines, accounts see invoices, production sees parts. Nobody sees kWh per part, because nobody owns it.

Energy doesn't only cost you on the bill. Siemens names rising energy prices as the main reason an hour of industrial downtime now costs more. source (opens in a new tab)Siemens, True Cost of Downtime 2024 A figure published by a company that sells the solution. We show it, but with this label.

For larger plants it is also a legal duty. Directive (EU) 2023/1791 requires an energy audit from enterprises using more than 10 TJ a year (about 2.8 GWh, all forms of energy), first due in October 2026, and an energy management system above 85 TJ (about 23.6 GWh) by October 2027. The data we set up is the data the auditor will ask for. source (opens in a new tab)European Commission, Energy Efficiency Directive (EU) 2023/1791 The text of a law or regulation, linked to its official publication.

Totalby hourby loadPaid

How it works on your floor

Three steps. None of them stops the line.

  1. 1 What you already have

    What you already measure

    The main meter, sub-meters on your panels, machine PLCs, the production plan and 12–⁠24 months of bills. Where a measurement is missing, we fit split-core current transformers to the 5–⁠10 biggest loads. They close around the cable; nothing is disconnected.

    Modbus · OPC UA · MQTT · CSV

  2. 2

    The model

    It learns each load's fingerprint: what it draws per part, per mould, per degree of outside temperature. It separates the energy that makes things from the energy that just waits, and forecasts tomorrow's peak from tomorrow's schedule.

    load disaggregation · peak forecast

  3. 3 The decision, inside your system

    An alert or a schedule, in your system

    The shift lead gets a message on Viber or on the line screen. The planner sees which loads can move tomorrow and what each option costs. Nothing switches itself on or off unless you decide it should, load by load.

    “Compressor 2: drawing 18% more than yesterday for the same output. Possible leak in the air network.”

    An example alert, as it would reach your team.

    Viber · email · line screen · ERP

Three-step diagram: meters, PLCs and bills feed a load model, which sends alerts and a load-shifting schedule to the shift lead.

Hardware: often none. If measurements are missing, sub-meters are fitted by your electrician or a hardware partner. We take care of the data, the models, the dashboards and the alerts.

What we measure

Four numbers, measured before we touch anything.

This image was created with an AI tool (AI Act, Article 50).
Fig. 1 — 03:00, no shift on. The fan still turns: base load with no output.

The formulas are the same for everyone. The values are yours, measured before the pilot.

  1. kWh per good unit

    meterERP

    The formula kWh in the period ÷ units that passed quality control

    Scrap doesn't count as output. The energy spent on it does.

    We measure it in the baseline period. We don't show a number we haven't measured.
  2. Peak demand (kW)

    meter

    The formula the highest average demand per metering interval in the month

    Many medium-voltage tariffs charge for demand, not only for kWh.

    We measure it in the baseline period. We don't show a number we haven't measured.
  3. Blended cost (€/MWh)

    bill

    The formula (energy + network and demand charges + regulated charges) ÷ MWh

    The number to hold every supplier offer against, small print included.

    We measure it in the baseline period. We don't show a number we haven't measured.
  4. Base load with no output (kW)

    meterERP

    The formula kWh with zero output ÷ hours with zero output

    This is where air leaks hide, along with whatever was left running.

    We measure it in the baseline period. We don't show a number we haven't measured.

How the benefit is worked out

Monthly benefit = Σ(kWh shifted × price difference) + peak reduction in kW × demand charge €/⁠kW + kWh avoided × €/⁠MWh ÷ 1,000

Payback (months) = pilot cost ÷ (monthly benefit − monthly running cost)

We normalise for weather and output. Otherwise a cool June looks like a win.

The pilot

6–⁠10 weeks. The target is signed first.

If the target isn't met, the report says so, with the same numbers we would have shown if it had been.

NTX-PL-EN6–⁠10 weeks

Pilot charter

Scope
One plant or one building. The 5–⁠10 biggest loads. A shifting schedule for the flexible ones: cooling, compressed air, dryers, water heating, forklift charging.
Duration
6–⁠10 weeks
Phases
  1. Weeks 1–⁠2Meters and bills connected. Baseline period.
  2. Weeks 3–⁠6Load model, first alerts, a shifting schedule trialled with the shift lead.
  3. Weeks 7–⁠10Before-and-after measurement, normalised for weather and output. Decision: carry on or stop.
Target
Example target: cut the monthly peak by X kW, or kWh per unit by Y%, without a single unit less output. We set X and Y together, from your own baseline. An example target. Yours is set from your own baseline.
Cost
It starts with a Plant X-Ray, from €4,900, credited in full against the pilot.

Signed before any code is written.

Evidence

What we know, and where from.

  1. up to −40%

    in cooling energy at Google data centres, using machine learning (2016). An analogue, not a plant: it shows what a model can do with cooling loads, not what your plant will see.

    source (opens in a new tab)DeepMind, data-centre cooling (2016) A figure published by a company that sells the solution. We show it, but with this label. DeepMind, data-centre cooling (2016)

  2. Main driver

    of the rising cost of industrial downtime: higher energy prices.

    source (opens in a new tab)Siemens, True Cost of Downtime 2024 A figure published by a company that sells the solution. We show it, but with this label.

  3. 10 TJ · 85 TJ

    The thresholds in Directive (EU) 2023/1791 for an energy audit and for an energy management system.

    source (opens in a new tab)European Commission, Energy Efficiency Directive (EU) 2023/1791 The text of a law or regulation, linked to its official publication.

  4. 7.77% · 17.27%

    of manufacturers with 10+ staff use AI, in Greece and in the EU (2025).

    source (opens in a new tab)Eurostat, AI use by sector (isoc_eb_ain2), 2025 Figures from an official statistics body, with the year shown.

Our own measured project

We haven't published a measured energy project yet. The first one could be in your plant.

Vendor figures show what happened elsewhere, in their best cases. They are not a promise to you.

Honest limits

What it won't do. And what it needs from you.

Show one of the model's mistakes and how we handle it

One of its mistakes, in fullTuesday 10:12A typical mistake of this kind, and how it is handled.

What the model said
The model said: “Compressor 2, 22% above expected. Possible leak.”
What actually happened
In fact a new mould with more pneumatic ejectors had gone on. The air was needed.
What happened next
The operator tapped “Expected” and typed the reason. The model filed the new fingerprint. Every false alarm is counted in the pilot report.

What it needs from you

  • At least 3 months of bills; ideally 12–⁠24, so the seasons show.
  • A load curve from the main meter, or from logging sub-meters.
  • The production plan, from the ERP or the shift's spreadsheet.
  • Someone in maintenance who knows which loads can wait and which can't.

What it won't do

  • It doesn't switch supplier or tariff for you. It shows what each would cost on your own curve.
  • It never moves loads that affect quality or safety. Your production lead locks those on day one.
  • It doesn't replace the energy auditor where the law requires one. It hands them clean data.
  • It promises no savings percentage before the X-Ray. Nobody serious can.

Play with the curve

Drag the loads out of the peak.

A plastics plant, 24 hours, in 15-minute steps. The hatched loads are production and stay put. The rest can wait, within their limits.

An example calculation for a typical plant. Your own figures come from the X-Ray.

Fully playable by keyboard. Tab: pick a load · ← →: 15 minutes · Shift + ← →: 1 hour · Enter: drop · Esc: cancel

Skip the demo: read how it works
Peak demand664 kW
Cost of the day€1,281
Blended cost144.6 €/MWh
kWh per unit0.92Units today: 9,600
  • Expensive window
  • Cheaper hours
  • Production · fixed
  • Flexible load · drag it
  • Material dryer 106:00–09:0035 kW
  • Material dryer 206:00–09:0035 kW
  • Material dryer 306:00–09:0035 kW
  • Staff hot water12:00–14:0024 kW
  • Chiller · mould-water tank pre-cool18:00–19:3090 kW
  • Compressor 2 · air-receiver fill19:00–20:0055 kW
  • Forklift charging (×4)18:00–24:0024 kW

In the demo, a plastics plant peaks in the morning, when all three dryers start together, and again inside the expensive 18:00–⁠22:00 window, when the chiller, the compressor and forklift charging pile onto production. The model's proposal staggers the dryers overnight, pre-cools the mould water before 18:00, fills the air receiver off-peak and charges the forklifts after 22:00. The peak drops and the day costs less, with not one unit changed in the schedule.

What you just saw

Mechanism
Load shifting and staggered start-ups.
Why it works
Production rarely sets the peak. Whatever starts alongside it does.
Data it needs
A 15-minute load curve, the production plan, each load's limits.
Honest range
What your plant gains depends on its contract and how many loads have slack. We measure it in the X-Ray. We don't guess it.

Same logic, another trade

Every trade hides its energy somewhere else.

Same mechanism: measure, separate the loads, move whatever can wait. Six places it works.

Use cases: the same mechanism at work in other trades.

Industrial hotel laundry, Heraklion

Dryers heating empty drums

What nobody sees
In July the flatwork ironers and tumble dryers run two shifts. Between loads they sit hot and empty, and the big ones all start at once when the lorry arrives from the hotels.
What the AI does
Load sequencing around lorry arrival times, staggered start-ups, an alert when a machine sits hot and empty past its limit.
What we'd measure
Energy (electricity and gas) per kilo of linen · peak kW · minutes idling hot

The scenario goes into the X-Ray form. Nothing goes into the page address.

120-room hotel, Hersonissos

Cooling empty rooms

What nobody sees
Air conditioning running in rooms after check-out, and pool heat pumps on a fixed timer, whatever the occupancy or the weather.
What the AI does
Cooling driven by bookings in the PMS, pool heating in the cheaper hours, an alert for rooms being cooled with no guest.
What we'd measure
kWh per guest-night · August peak kW · energy cost per room

The scenario goes into the X-Ray form. Nothing goes into the page address.

Olive mill, Messara

Three months that decide the year

What nobody sees
From November to January the malaxers and decanters run day and night. The peak is set when two lines start together with their feed augers and olive washers.
What the AI does
Staggered line start-ups, kWh per tonne of olives for each line, to show which one runs dearer, and an alert for lines turning with nothing in them.
What we'd measure
kWh per tonne of olives · season peak kW · hours running empty

The scenario goes into the X-Ray form. Nothing goes into the page address.

Winery, Peza (Heraklion)

Tanks chilled at the worst hour

What nobody sees
At harvest, the fermentation tanks warm up through the day and the chiller runs flat out exactly when power costs most. The presses and transfer pumps start at the same time.
What the AI does
A heat-load forecast for each tank from fermentation temperature and the weather, chilled water pre-cooled before the expensive window, a staggered schedule for presses and pumps. The winemaker locks each tank's temperature limits.
What we'd measure
kWh per hectolitre · harvest peak kW · chiller hours inside the expensive window

The scenario goes into the X-Ray form. Nothing goes into the page address.

Animal-feed mill, Larissa

Grinding for a bin that's already full

What nobody sees
The hammer mill, the pellet press and the steam boiler all start at 07:00 to get the first batch out. The month's peak is set in the first twenty minutes of the shift. And the mill often grinds for a bin that already holds enough.
What the AI does
Tomorrow's grinding moved into the cheap hours, based on orders and bin levels, staggered start-ups for the big motors, and an alert when the mill runs for no reason.
What we'd measure
kWh per tonne of feed · peak kW · grinding hours inside the expensive window

The scenario goes into the X-Ray form. Nothing goes into the page address.

Irrigation pumping station, Thessaly plain

Water pumped at the wrong hour

What nobody sees
The pumps refill the reservoir whenever the level drops, whatever the hour. In July that often means the expensive hours.
What the AI does
Water demand forecast from the irrigation schedule, the reservoir filled in the cheap hours, staggered pump start-ups.
What we'd measure
kWh per cubic metre · peak kW · pumping hours inside the expensive window

The scenario goes into the X-Ray form. Nothing goes into the page address.

Questions

Do we need to buy equipment?

Usually not. We start from your main meter, PLCs and bills. If a big load isn't metered, we add split-core current transformers that close around the cable with nothing disconnected. The Plant X-Ray lists exactly what's needed before anything is bought.

Will output or quality suffer?

No, because you set the rules. At the start of the pilot your production lead locks everything that must not move: presses, ovens, any cooling that touches the product. Only loads with slack move, such as dryers, compressed air and charging. The pilot target says “no loss of output” in writing.

What does it cost, and when does it pay back?

We start with a Plant X-Ray, from €4,900, credited in full against the pilot. Payback is worked out with the formula on this page and your own numbers. We don't quote a savings percentage before measuring.

Does it work with our current electricity contract?

Yes. We model the contract you have, with its energy, network and demand charges. If your price changes from hour to hour, shifting loads is worth more. If it's flat, the gains come mostly from the peak and the base load. We don't sell electricity.

Does it cover us for the Directive's energy audit?

Not on its own. The energy audit is carried out by an auditor, as the law sets out. The data we put in place is what they will ask for: curves by load, kWh by product, base load. If you use more than 85 TJ a year, it is also the foundation of the energy management system you will need.

Is there funding?

Possibly. The Plant X-Ray includes an annex showing which programme could cover which part, always subject to the text of the current call. We don't sell grants. We tell you which one fits, if any does.

Next step

Show us three electricity bills.

In the Plant X-Ray we lay your load curve next to your production plan and show you which hours you pay for with nothing to show.

  • From €4,900 · 10 working days at your plant
  • Credited in full against a pilot signed within 60 days.

We sit your plant's safety induction before we set foot on the line.