

Skip to main content Skip the demo: read how it works

Η σελίδα υπάρχει και στα ελληνικά. Διαβάστε τη στα ελληνικά

Book an X-RayX-Ray Book a Workflow X-Ray: a fixed-price diagnosis

Data & decisions

Thursday the 12th. The accountant finally sends last month's numbers.

The month closes on the 12th of the next one.Data and decision dashboards for business.

We join up the numbers living in five systems, clean them and show them on boards that update themselves. Every Monday, a one-page brief says what changed and what needs a decision.

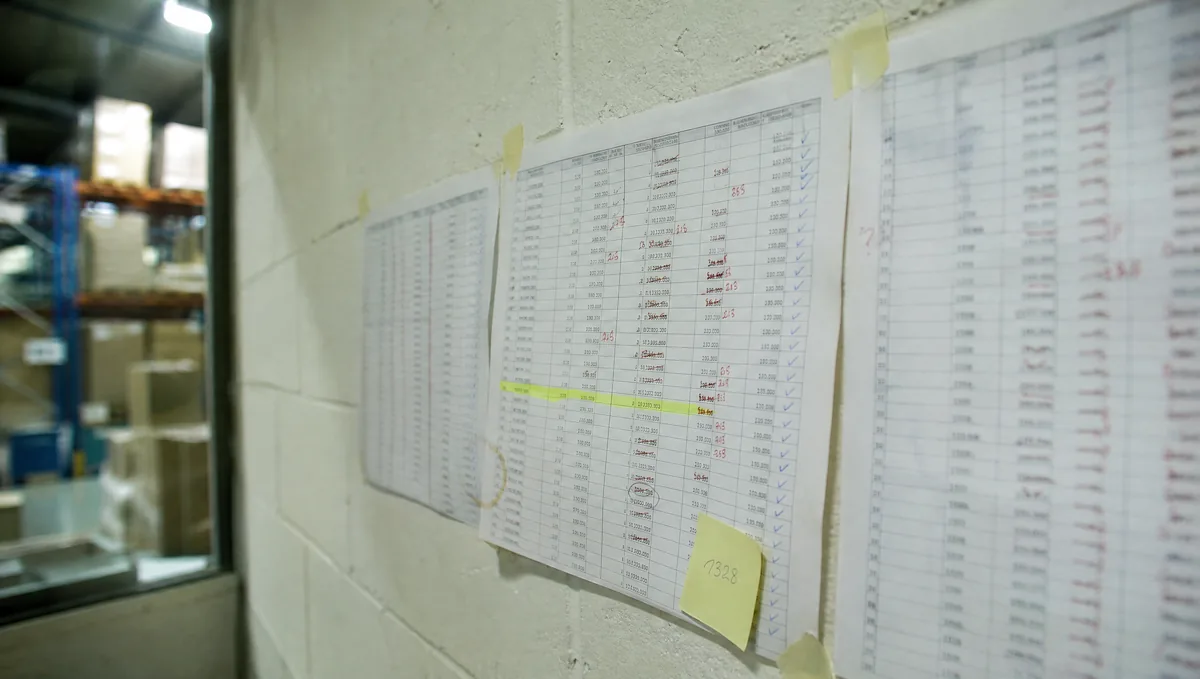
Printed spreadsheets taped to a warehouse office wall, covered in handwritten red corrections and blue ticks, with a sticky note and a highlighted row.corrected by handThis image was created with an AI tool (AI Act, Article 50).

The demo didn't load. The text below says what you would have seen.

Ask the numbers

An example that shows how it works.

A food and drinks wholesaler, mainland and islands

Pick a question

Here you pick one of four questions. On your own data, you ask in your own words.

051015€ thousands1042€14,900 · 47 days2210€8,250 · 41 days0877€6,100 · 38 days1531€5,420 · 35 days3304€3,750 · 31 days051015€ thousands1042€14,900 · 47 days2210€8,250 · 41 days0877€6,100 · 38 days1531€5,420 · 35 days3304€3,750 · 31 days

The answer, in one paragraph

Five customers have invoices more than 30 days past due, €38,420 in total. Customer 1042 has the largest balance (€14,900, 47 days) and is the only one of the five who paid on time until August. Worth calling first.

How it was worked out

The query in plain words

Sales invoices with an open balance more than 30 days past due, by customer, sorted by amount.

The query in SQL

SELECT customer_code, SUM(open_amount) AS overdue, MAX(days_past_due) AS days
FROM ar_open_items
WHERE days_past_due > 30
GROUP BY customer_code
ORDER BY overdue DESC
LIMIT 5;

The numbers come from a query on the data. The AI only writes the words around them.

See the numbers as a table
CustomerOverdueDays past due
1042€14,90047
2210€8,25041
0877€6,10038
1531€5,42035
3304€3,75031
Total€38,420
16%20%24%28%3839404142434445Week330 ml soft drinks · 20.7%500 ml water · 18.6%1 L juice · 27.3%16%20%24%28%3839404142434445Week330 ml soft drinks · 20.7%500 ml water · 18.6%1 L juice · 27.3%

The answer, in one paragraph

330 ml soft drinks fell from 24.1% to 20.7% gross margin in six weeks. The purchase price rose 7% on the 3 November invoice; selling prices stayed put. The other nine products in the category are behaving normally.

How it was worked out

The query in plain words

Gross margin per item and week over the last 8 weeks: (sales − cost of sales) ÷ sales.

The query in SQL

SELECT sku, iso_week,
       (SUM(net_sales) - SUM(cost_of_sales)) / NULLIF(SUM(net_sales), 0) AS gross_margin
FROM sales_lines
WHERE invoice_date >= CURRENT_DATE - INTERVAL '8 weeks'
GROUP BY sku, iso_week;

The numbers come from a query on the data. The AI only writes the words around them.

See the numbers as a table
Week330 ml soft drinks500 ml water1 L juice
3824.2%18.4%27.1%
3924.1%18.6%27.3%
4023.6%18.5%27.0%
4123.0%18.3%27.2%
4222.4%18.6%27.4%
4321.8%18.5%27.1%
4421.3%18.4%27.2%
4520.7%18.6%27.3%
02468€ millionsJanFebMarAprMayJunJulAugSepOctLast year · €7,300,000This year · €7,577,00002468€ millionsJanMarMayJulSepLast year · €7,300,000This year · €7,577,000

The answer, in one paragraph

Since January, sales are 3.8% ahead of last year. Almost all of the difference comes from the islands (+11.2%); the mainland is flat (+0.6%).

How it was worked out

The query in plain words

Cumulative sales from 1 January this year and the same period last year, by region.

The query in SQL

SELECT region, EXTRACT(YEAR FROM invoice_date) AS yr, SUM(net_sales) AS ytd_sales
FROM sales_lines
WHERE EXTRACT(DOY FROM invoice_date) <= EXTRACT(DOY FROM CURRENT_DATE)
GROUP BY region, yr;

The numbers come from a query on the data. The AI only writes the words around them.

See the numbers as a table
RegionLast yearThis yearChange
Islands€2,200,000€2,446,400+11.2%
Mainland€5,100,000€5,130,600+0.6%
Total€7,300,000€7,577,000+3.8%
€0€2€4€6€8€6.20Jul€6.25Aug€6.10Sep€6.90OctMainlandIslands€0€2€4€6€8€6.20Jul€6.25Aug€6.10Sep€6.90OctMainlandIslands

The answer, in one paragraph

Courier cost per order rose to €6.90, from €6.10 in September. Island deliveries went up to 31% of orders, from 22%, and cost roughly twice as much.

How it was worked out

The query in plain words

Courier cost ÷ number of orders, by month and destination type.

The query in SQL

SELECT DATE_TRUNC('month', ship_date) AS month, destination_type,
       SUM(courier_cost) / COUNT(DISTINCT order_id) AS cost_per_order
FROM shipments
GROUP BY month, destination_type;

The numbers come from a query on the data. The AI only writes the words around them.

See the numbers as a table
MonthIsland share of ordersCourier cost per order
Jul24%€6.20
Aug25%€6.25
Sep22%€6.10
Oct31%€6.90

Why it works

Mechanism
A clean data model with queries on top. The AI turns the question into a query and the result into words.
Why it holds
Every number has an address: it leads to the query and the rows it came from.
What we measure
Days to close the month · hours spent on reports · how many people open the boards
What to expect, honestly
How fast your month can close depends on your systems. We show you in the X-Ray.

The problem

The numbers exist. They just live in five places.

Sales sit in the ERP, orders in the e-shop, advertising in Google and Meta, payments at the bank, production in a spreadsheet. To answer a simple question, someone exports it all and joins it by hand, and the answer arrives after the decision has been made.

Greek firms with 10+ staff use data analytics at a rate of 31.45%, against 39.85% across the EU (2025). European Commission, Digital Decade 2026, via Naftemporikisource European Commission, Digital Decade 2026, via Naftemporiki (opens in a new tab)

  • ERP: sales, purchasing, stock
  • E-shop: orders, returns
  • Advertising: Google, Meta
  • Bank and accounts: payments, receipts
  • Production or CRM: whatever you keep in spreadsheets

How it works

Clean data first. Then AI.

If the same product has three codes in three systems, no AI will tell you correctly how much of it you sell. So we join and clean first, and add AI after.

  1. What you already have

    We read from the systems you already use: ERP, e-shop, ads, CRM, bank, production. You change nothing.

  2. One clean data model

    One code per product, one name per customer, the same definitions for everyone. Duplicates and gaps get fixed before anything else.

  3. Boards, alerts, the brief

    5 to 10 measures per role, alerts when something drifts, and every Monday a one-page brief written by AI.

Only 10% of AI's value comes from the application itself. 20% comes from data and technology; 70% from the workflow, the people and how it's governed.

We build on tools you can keep, such as Power BI, Looker Studio or Metabase. The data stays yours.

The cockpit

Five to ten measures. Not a hundred.

  • Average days to collect

    (with your own data)

    How it's calculated

    receivables ÷ credit sales × days in period

  • Gross margin by product and customer

    (with your own data)

    How it's calculated

    (sales − cost of sales) ÷ sales

  • Sales pace against last year

    (with your own data)

    How it's calculated

    year-to-date sales ÷ same period last year − 1

  • Days of stock

    (with your own data)

    How it's calculated

    stock ÷ average daily cost of sales

  • Days to close the month

    (with your own data)

    How it's calculated

    closing date − last day of the month

  • Delivery cost per order

    (with your own data)

    How it's calculated

    courier cost ÷ orders

  • Forecast error

    (with your own data)

    How it's calculated

    average of the absolute (actual − forecast) ÷ actual

  • Customer acquisition cost

    (with your own data)

    How it's calculated

    ad spend ÷ new customers

The Monday brief

One page. What changed, what needs a decision, what we don't know.

Every Monday at 07:00, the AI writes a brief from the week's data. The numbers come from queries, not from the model's memory. A person reads it before it reaches management.

Food and drinks wholesale · for management

The Monday brief · week 45 · 2–8 November 2026

At a glance

  • Sales this week: €184,300, up 6.2% on the same week last year. Year to date: up 3.8%.
  • Gross margin: 21.4%, down 1.1 points. Most of the drop comes from 330 ml soft drinks.
  • Days to collect: 58, up from 54 in October.

What changed

  • 330 ml soft drinks: margin down 3.4 points. The supplier raised the purchase price 7% on the 3 November invoice; selling prices haven't moved.
  • Customer 1042 hasn't ordered for 23 days. They usually order every 7.
  • Courier cost per order: €6.90, up from €6.10. Cause: more island deliveries (31% of orders, up from 22%).

Needs a decision

  • Reprice the 330 ml soft drinks? At the current price, margin loses about €1,900 a month.
  • Call customer 1042 this week. They also have the largest overdue balance (€14,900).
  • Five customers are over their credit limit. The list is on the “Receivables” board.

What we don't know yet

  • Thursday's returns haven't been entered in the ERP. Margin could move by up to 0.3 points.

Written automatically by AI at 07:00 on Monday from ERP and bank data. Every number links to the query it came from. Checked by: Finance lead.

An example that shows how it works.The numbers come from the data model. The AI writes the text; a person reads and signs it.

Query

SELECT SUM(net_sales) AS week_sales,
       SUM(net_sales) / NULLIF((SELECT SUM(net_sales) FROM sales_lines
         WHERE iso_year = 2025 AND iso_week = 45), 0) - 1 AS vs_last_year
FROM sales_lines
WHERE iso_year = 2026 AND iso_week = 45;

Query

SELECT region, EXTRACT(YEAR FROM invoice_date) AS yr, SUM(net_sales) AS ytd_sales
FROM sales_lines
WHERE EXTRACT(DOY FROM invoice_date) <= EXTRACT(DOY FROM CURRENT_DATE)
GROUP BY region, yr;

Query

SELECT iso_week,
       (SUM(net_sales) - SUM(cost_of_sales)) / NULLIF(SUM(net_sales), 0) AS gross_margin
FROM sales_lines
WHERE iso_year = 2026 AND iso_week IN (44, 45)
GROUP BY iso_week;

Query

SELECT snapshot_date,
       SUM(open_amount) / NULLIF(SUM(credit_sales_90d), 0) * 90 AS days_to_collect
FROM ar_snapshots
WHERE snapshot_date IN ('2026-10-31', '2026-11-08')
GROUP BY snapshot_date;

Query

SELECT sku, iso_week,
       (SUM(net_sales) - SUM(cost_of_sales)) / NULLIF(SUM(net_sales), 0) AS gross_margin
FROM sales_lines
WHERE invoice_date >= CURRENT_DATE - INTERVAL '8 weeks'
GROUP BY sku, iso_week;

Query

SELECT invoice_date, unit_cost,
       unit_cost / LAG(unit_cost) OVER (ORDER BY invoice_date) - 1 AS change
FROM purchase_lines
WHERE sku = 'SD-330'
ORDER BY invoice_date DESC
LIMIT 2;

Query

SELECT customer_code,
       CURRENT_DATE - MAX(order_date) AS days_since_last_order,
       AVG(days_between_orders) AS usual_gap
FROM customer_orders
WHERE customer_code = '1042'
GROUP BY customer_code;

Query

SELECT DATE_TRUNC('month', ship_date) AS month, destination_type,
       SUM(courier_cost) / COUNT(DISTINCT order_id) AS cost_per_order
FROM shipments
GROUP BY month, destination_type;

Query

SELECT DATE_TRUNC('month', ship_date) AS month,
       AVG(CASE WHEN destination_type = 'island' THEN 1.0 ELSE 0 END) AS island_share
FROM shipments
GROUP BY month;

Query

SELECT SUM(units_per_month * (unit_cost_now - unit_cost_before)) AS margin_lost_per_month
FROM sku_monthly
WHERE sku = 'SD-330';

Query

SELECT customer_code, SUM(open_amount) AS overdue, MAX(days_past_due) AS days
FROM ar_open_items
WHERE days_past_due > 30
GROUP BY customer_code
ORDER BY overdue DESC
LIMIT 5;

Query

SELECT SUM(net_amount) AS unposted_returns
FROM returns_inbox
WHERE received_date = '2026-11-05' AND posted_to_erp = FALSE;

Other sectors, same method

Six questions somebody asks every week.

From a dairy in Thessaly to a bakery with four shops: the answer is already in the data. It just arrives late.

Use cases built on how Greek businesses actually work. Wherever there's a number, its source or its maths sits right beside it.

How this mechanism runs for a business in this sector, step by step.
Dairy · ThessalyBefore-and-after diagram: Dairy · Thessaly. Today: sales in the ERP, weather on a phone, promotions in email, decided by gut feel (every Friday). With the dashboard: history, season, weather, promos, forecast per SKU, quantity with a range, production decides. We measure: forecast error. Use case. Today Dairy · Thessaly Salesin the ERP Weatheron a phone Promotionsin email Decided by gutfeel every Friday With the dashboard History, season,weather, promos Forecast per SKU Quantity witha range Production decides we measure forecast error use case
Today
Sales per item sit in the ERP, the weather on someone's phone, supermarket promotions in email. Nobody sees them together.
With the dashboard
A forecast per item combines history, season, weather and promotions, and suggests a production quantity as a range, not a single number.
The human
The production manager decides. The forecast is a suggestion, not an order.
We measure
Forecast error · returns and expiries · shelf stock-outs
The maths
We put a number on it only after comparing forecast and reality on your own data.

How this mechanism runs for a business in this sector, step by step.
Food wholesalerBefore-and-after diagram: Food wholesaler. Today: balances from the ERP, bank payments, list built by hand (an afternoon). With the dashboard: ERP and bank, every morning, days to pay per customer, who to call first, a person makes the call. We measure: average days to collect. Use case. Today Food wholesaler Balances fromthe ERP Bank payments List built by hand an afternoon With the dashboard ERP and bank,every morning Days to payper customer Who to call first A person makesthe call we measure average daysto collect use case
Today
The finance lead exports balances from the ERP, matches them against bank payments and builds the list by hand. By the time it's done, it's out of date.
With the dashboard
The board refreshes every morning: days to pay per customer, who is over their credit limit, who is paying later and later.
The human
The board suggests who to call first. A person makes the call.
We measure
Average days to collect · overdue beyond 90 days · hours spent on the report
The maths
We put a number on it only after measuring your own workflow.

How this mechanism runs for a business in this sector, step by step.
Homeware e-shopBefore-and-after diagram: Homeware e-shop. Today: turnover in the ERP, courier costs, ad spend, nobody joins them up (never measured). With the dashboard: five sources, one model, net margin per product, one paragraph every Monday, prices: a person changes them. We measure: margin per product. Use case. Today Homeware e-shop Turnoverin the ERP Courier costs Ad spend Nobody joinsthem up never measured With the dashboard Five sources, onemodel Net marginper product One paragraphevery Monday Prices: a personchanges them we measure margin per product use case
Today
The ERP shows turnover. Courier costs, returns, cash-on-delivery fees and ad spend sit in four other systems.
With the dashboard
Net margin per product and per channel, after courier, returns, fees and advertising. Every Monday, one paragraph says what changed.
The human
People change prices and campaigns. The board shows; it doesn't decide.
We measure
Margin per product · cost of returns · ad cost per order
The maths
We put a number on it only after measuring your own workflow.

How this mechanism runs for a business in this sector, step by step.
80-room hotel · RethymnoBefore-and-after diagram: 80-room hotel · Rethymno. Today: bookings in the PMS, commissions on invoices, direct bookings in the web engine, the picture shows up in June (March → June). With the dashboard: PMS, channels, website, daily, booking pace vs last year, direct share, channel cost, rates: the revenue manager. We measure: booking pace. Use case. Today 80-room hotel · Rethymno Bookingsin the PMS Commissionson invoices Directbookingsin the webengine The pictureshows upin June March → June With the dashboard PMS, channels,website, daily Booking pace vslast year Direct share,channel cost Rates:the revenuemanager we measure booking pace use case
Today
Bookings sit in the PMS, platform commissions on invoices, direct bookings in the website's booking engine.
With the dashboard
Booking pace against last year, direct-booking share and net room rate per channel, on one board refreshed daily.
The human
Rates are set by the revenue manager or the owner.
We measure
Booking pace · direct share · net room rate per channel
The maths
We put a number on it only after measuring your own workflow.
What others measured
Only 8.7% of room nights at Greek hotels are booked in real time through the hotel's own website (sample of 128 hotels, 2025 data). HOTREC, European Hotel Distribution Study 2026 (2025 data), via To VimaHOTREC, European Hotel Distribution Study 2026 (2025 data), via To Vimasource HOTREC, European Hotel Distribution Study 2026 (2025 data), via To Vima (opens in a new tab)

How this mechanism runs for a business in this sector, step by step.
Building materials · VolosBefore-and-after diagram: Building materials · Volos. Today: new price on the invoice, nobody notices (February → June), margin melting away. With the dashboard: invoices from myDATA, compared with the last price, in the Monday brief, selling price: a person. We measure: days to reprice. Use case. Today Building materials · Volos New priceon the invoice Nobody notices February → June Margin melting away With the dashboard Invoices frommyDATA Compared withthe last price In the Mondaybrief Selling price:a person we measure days to reprice use case
Today
Purchase prices change line by line on invoices. Selling prices stay put until someone notices.
With the dashboard
Every incoming invoice is compared with the last price paid for the same item. Increases above your threshold go into the Monday brief, with the products they affect.
The human
A person changes the selling price.
We measure
Days from a cost increase to repricing · margin per category
The maths
We put a number on it only after measuring your own workflow.

How this mechanism runs for a business in this sector, step by step.
Bakery · 4 shopsBefore-and-after diagram: Bakery · 4 shops. Today: order phoned in, based on yesterday, too much or too little (19:00 / 14:00). With the dashboard: till sales by hour and shop, suggested order for tomorrow, the shop adjusts it, order to the bakehouse. We measure: waste per shop. Use case. Today Bakery · 4 shops Order phoned in Based on yesterday Too much or toolittle 19:00 / 14:00 With the dashboard Till sales by hourand shop Suggested orderfor tomorrow The shopadjusts it Orderto the bakehouse we measure waste per shop use case
Today
Orders to the bakehouse are phoned in, based on yesterday.
With the dashboard
Till sales by hour and by shop show when each product runs out. Tomorrow's suggested order accounts for the weekday, the weather and holidays.
The human
The shop manager adjusts the suggestion before the order goes out.
We measure
Waste per shop · time each product runs out · suggestion accuracy
The maths
We put a number on it only after measuring your own workflow.

The form opens with your sector selected. Nothing goes into the page address.

What we measure

A dashboard nobody opens is a cost.

  • Days to close the month
  • Hours spent on reports, before and after
  • Who opens which board, and how often
  • Decisions backed by the board or the brief
  • Forecast error, wherever there is a forecast

That's why we measure use as well. If a board isn't being opened, we either change it or remove it.

What the measurements say

The numbers that aren't ours, with sources.

Become our first measured case in your sector.

We'd like to be first

BundleData

Decision Cockpit

One data model, the boards you need, and the Monday brief.

  1. A data model joining ERP, e-shop, ads, CRM, bank and production
  2. 5 to 10 measure boards, by role
  3. A weekly brief written by AI, checked by a person
  4. Alerts on credit limits, stock and margin
  5. A monthly data-quality check
  6. Training for your team

Price: after the X-Ray, once we know what's worth building.

Start with the X-Ray

Questions

What is a business data dashboard?

A board that gathers the numbers from your ERP, e-shop, ads and bank in one place and updates itself. It shows 5 to 10 measures per role, not a hundred. Alongside it, every Monday, a one-page brief says what changed, what needs a decision and what we don't know yet.

Do we need to change our ERP?

No. We read from the systems you already have, such as SoftOne, Entersoft, Epsilon, WooCommerce and your bank, and join them into one data model. If a system can't share data safely, we tell you in the X-Ray, before any work starts.

How clean does our data need to be?

It doesn't need to be clean for us to start; we need to know how messy it is. The first month includes a quality check: duplicate codes, customers with two names, gaps. We fix those before adding AI, because otherwise AI just repeats the mistakes faster.

Can the AI make numbers up?

Not in this system. The numbers come from queries on your data, and every number links to the query it came from. The AI only writes the words around them, and a person reads the brief before it reaches management.

How much does it cost?

We start with a Workflow X-Ray, from €890, credited in full against what follows. There we see what data you have, how clean it is and which questions are worth answering automatically. We price the Decision Cockpit afterwards, based on the sources and boards you need.

Who sees what?

Each role sees its own boards. Sales don't see payroll, and a shop manager doesn't see company-wide margins. You set the permissions, and every view is logged. Access follows the role, so when someone changes jobs, what they can see changes with them.

Which question would you like answered on its own every Monday?

In the X-Ray we look at what data you have, how clean it is and how fast your month could close.

From €890 · credited in full against what followsThe question you picked in the demo goes into the form. Nothing goes into the page address.